Have you ever opened an SEO report, looked at 30 different numbers, and still wondered, “So… is our SEO actually working?”
You’re not alone.
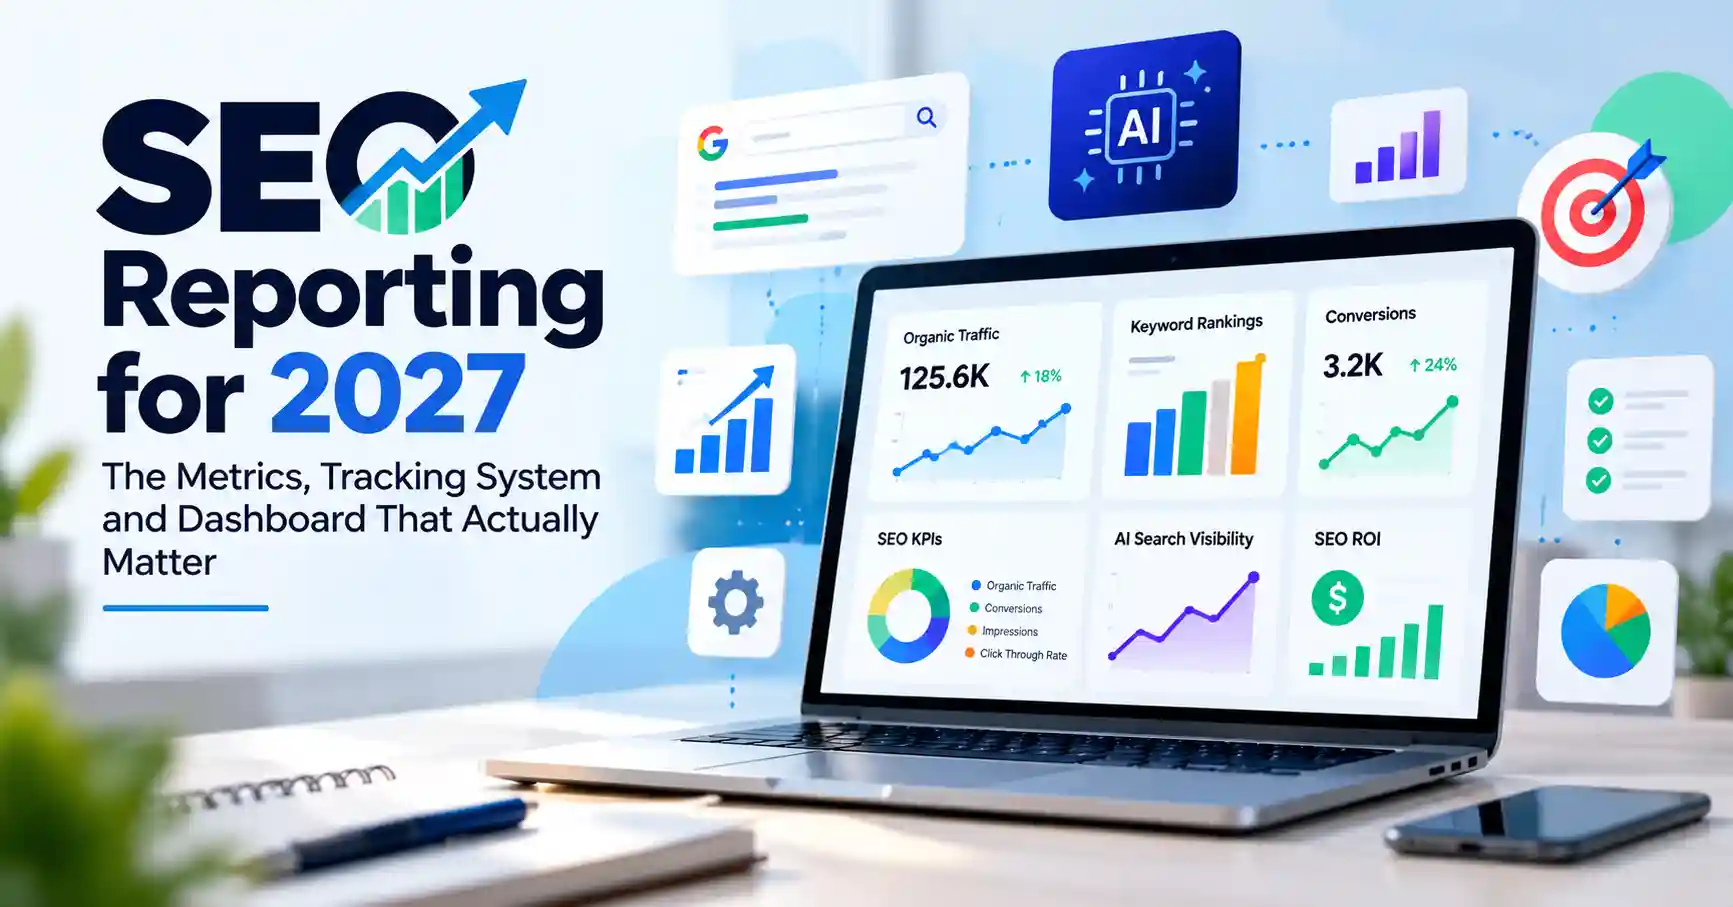
SEO reporting has changed. A few years ago, ranking positions and organic traffic could tell most of the story. In 2027, that picture is much bigger. Businesses need to understand search visibility, qualified traffic, conversions, technical health, content performance and increasingly, visibility across AI powered search experiences.
The goal isn’t to create a report packed with charts. It’s to create a simple story: what changed, why it changed, what it means for the business, and what should happen next.
What is SEO reporting and why does it matter in 2027?
SEO reporting is the process of collecting, analyzing and presenting search performance data over a consistent period. A useful report connects SEO activity with measurable outcomes instead of simply showing that someone published five articles or built ten backlinks.
Search Engine Land’s Ludwig Makhyan makes an important point in the reference guide: SEO reports need the right data and a compelling story because different audiences care about different things.
That idea is still relevant in 2027.
A business owner may care about leads and revenue. A content manager may care about pages gaining visibility. An SEO specialist may want to investigate ranking changes, indexing and technical problems.
So before opening Google Analytics or Search Console, ask one simple question:
What decision should this report help someone make?
That question can save you from creating a beautiful dashboard nobody actually uses.
Which SEO metrics should you track every month?
Tracking every single SEO metric out there is a trap. Honestly, monitoring everything just blurs the picture and hides the stuff that actually matters.
Keep it simple. Pick a lean handful of metrics tracking visibility, traffic, and real business impact.
Organic traffic matters most, Watch the unpaid search volume closely. Is it climbing, or dropping off? Don’t just stare at the grand total, though. Slice that data up by landing page, device, country, or even search intent when it makes sense.
Search impressions count too. They show how often your pages pop up in search results. If impressions are spiking while clicks stay flat, take note. That is a blinking red light telling you that visibility is up, but nobody is biting.
Click through rate tells you if people actually care when they see your result.
Keyword rankings need attention, but focus only on key commercial, informational, and brand terms. Forget tracking hundreds of random keywords.
Conversions tie everything back to reality. Leads, sales, signups, phone calls, or whatever meaningful action you track. Do those organic visitors actually move the needle for your bottom line?
Backlinks and referring domains still deserve a glance. Links do not tell the whole story, but shifts in your link profile often explain why your authority and visibility just moved.
Google suggests pairing Search Console with Analytics. Search Console covers what happens out there on Google Search, while Analytics reveals what people actually do once they land on your site.
That’s a much more useful picture than simply saying, “Traffic went up 18%.”
How should you build an SEO dashboard that people actually read?
An SEO dashboard should answer questions quickly.
A good dashboard can start with five blocks:
- Organic search performance
- Keyword and visibility changes
- Landing page performance
- Organic conversions and revenue
- Technical or content issues requiring action
Keep that initial screen simple. Anyone ought to open the dashboard and instantly grasp performance direction within sixty seconds. Such profound clarity truly matters deeply.
For example:
Organic clicks: Up 14% month over month
Non brand clicks: Up 9%
Organic leads: Up 11%
Top performing page: Product comparison guide
Biggest concern: Three commercial pages lost visibility
Now the report tells a story.
Drop extra charts right below if anyone needs a deeper dive. Google also shows you how to hook Search Console up to Analytics via Looker Studio. That trick brings your search visibility and on site behavior together in one clean view. Real handy.
The trick is not to create more charts. It’s to create fewer charts that lead to better decisions.
How do you make keyword ranking tracking more useful?
Keyword ranking tracking is still important, but the old approach of celebrating every position change doesn’t work very well.
A keyword moving from position 17 to 12 may be positive, but it doesn’t necessarily mean your business gained meaningful traffic.
Instead, group keywords by:
- Search intent
- Topic
- Product or service
- Brand vs. non brand
- Funnel stage
- Priority landing page
Then monitor meaningful movement.
For example, imagine 20 keywords related to “SaaS billing software.” Instead of reporting every keyword individually, report that the group gained visibility and identify the pages responsible for the change.
Also look for keywords sitting around positions 4–15. These can reveal practical optimization opportunities because a relatively small improvement may bring additional clicks.
Search Console can also help you investigate queries with high impressions but relatively low CTR, while ranking tools can provide additional historical and competitor context. Google specifically recommends analyzing clicks, impressions, CTR, position, pages and queries together when investigating search performance changes.
For more practical Search Console analysis, you can also read our guide on making Google Search Console work harder for you.
Which SEO KPIs connect search performance to business results?
This is where many SEO reports fall short.
Traffic looks impressive on a graph, but traffic alone doesn’t pay the bills.
Your SEO KPIs should connect search activity with a business outcome.
Ecommerce sites track organic transactions, revenue, conversion rates, and earnings per session. SaaS companies watch organic leads, demo sign ups, free trials, pipeline opportunities, and paid plans instead. For a local storefront, calls, map directions, messages, and actual bookings matter way more. The core rule? Separate the leading indicators from actual business outcomes, Rankings, search impressions, and pure traffic just tell you if visibility is creeping upward.Leads, sales and revenue tell you whether that visibility is creating business value.
Semrush’s recent SEO KPI research makes a similar distinction, recommending that marketers select a small number of KPIs rather than attempting to track every available metric.
And don’t forget non brand performance. A website may receive plenty of branded searches simply because people already know the company. Separating branded and non branded performance can give you a clearer picture of discovery through SEO.
Our recent guide on Google Search Console’s branded queries filter can help with that analysis.
How should SEO reporting change for AI search?
This is probably the biggest change to your 2027 reporting process.
Traditional SEO reporting mainly asks:
Where do we rank?
Modern search reporting increasingly asks:
Where are we being discovered?
Your content may appear in traditional results, AI generated search experiences, featured results, answer focused interfaces or other search features. A user may also discover your brand through an AI answer without immediately producing the kind of website session you’d traditionally expect.
That means AI search visibility should become an additional layer of your reporting rather than a replacement for conventional SEO metrics.
Track things such as:
- AI search visibility
- Brand mentions
- AI citations where measurable
- Referral traffic from AI platforms
- Pages appearing in AI generated answers
- Queries associated with AI visibility
- Leads or conversions influenced by AI discovery
The measurement environment is still developing, so don’t pretend every AI visibility number is perfectly comparable with traditional Google Search metrics. Semrush’s current research also highlights that AI search reporting has different measurement challenges because visibility can occur without a conventional click.
Publishers, listen up: keep it simple, Only track what’s rock solid, and for the rest, the pure guesses, just label it. That’s it. Don’t let new AI metrics wreck your SEO.
How often should you track and report SEO performance?
Not every SEO metric needs to be checked every day.
A practical reporting rhythm looks something like this:
Weekly: Check major traffic changes, ranking movements, indexing problems, technical issues and unusual drops.
Monthly: Watch organic traffic, search performance, rankings, reach, and conversions shift right now.
Quarterly: Pause, Survey broad shifts, SEO returns, targets, rivals, link velocity, and strategic opportunities.
Daily checking can create unnecessary noise. Search performance naturally moves around, and reacting to every small fluctuation can lead to bad decisions.
Google’s own troubleshooting guidance recommends comparing longer time periods and looking for patterns across queries, pages and search types when investigating traffic changes rather than immediately assuming something is wrong.
A good report should therefore include context.
Instead of:
Organic traffic: 8%
Write:
Organic traffic declined 8% month over month, mainly because three high traffic informational pages lost clicks. Non brand impressions remained relatively stable, suggesting the next step is to investigate CTR and SERP changes before making major content decisions.
Now someone knows what happened and what to investigate.
What is the best way to measure SEO ROI in 2027?
SEO ROI is where reporting becomes genuinely useful for management.
A simple starting point is to compare the value generated through organic search with the investment required to produce that performance.
But SEO ROI isn’t always immediate.
A new article might take months to generate meaningful traffic. A technical fix might prevent future losses rather than create an obvious spike. A content refresh might improve rankings first and conversions later.
That’s why your report should connect activities to outcomes over time.
For example:
SEO activity → improved visibility → qualified organic traffic → conversions → revenue
Don’t force every conversion into a single SEO attribution bucket, either. Sales rarely happen in a straight line buyers jump across channels. So why track SEO? Not to grab all the credit, that is missing the mark. You do it to spot where organic search pulls its weight, where it falls short, and where dropping more cash makes sense.
FAQ’s
A proper SEO audit goes wide. It tracks traffic, clicks, ranks, pages, conversions, tech health, and the bottom line. It covers everything.
Hunt massive problems weekly, Examine core metrics monthly. Tackle that profound strategy every single quarter.
Rankings miss the point entirely. Traffic, visibility, conversions, and actual business revenue matter just as much. Look closely at the whole picture.
An SEO dashboard is a visual reporting system that brings important search performance data into one place so trends and problems can be identified quickly.
Sure, assuming reliable measures exist. Artificial intelligence visibility should augment standard analytics instead of entirely replacing rankings, organic traffic, and conversion numbers.
Conclusion
The best SEO reporting system for 2027 won’t be the one packed with the most graphs. It will simply be the one that makes your next choice easier.
Track fewer metrics, but make them count, Tie your SEO KPIs directly to bottom line business outcomes. Treat keyword rankings as background context rather than the whole story. Build a dashboard anyone can grasp in seconds, and fold in AI search visibility wherever reliable numbers exist.
Above all, stop throwing out stats just because some software hands them to you on a silver platter.
Answer three questions instead. What changed? Why cares? What do we do next?

Kumar Swamy is the CEO of Itech Manthra Pvt Ltd and a dedicated Article Writer and SEO Specialist. With a wealth of experience in crafting high-quality content, he focuses on technology, business, and current events, ensuring that readers receive timely and relevant insights.
As a technical SEO expert, Kumar Swamy employs effective strategies to optimize websites for search engines, boosting visibility and performance. Passionate about sharing knowledge, he aims to empower audiences with informative and engaging articles.
Connect with Kumar Swamy to explore the evolving landscape of content creation!